This AP Stats score calculator predicts your AP Statistics exam score on the 1–5 scale. Enter the points you earned on each section of a practice exam, and the calculator weights them the way the real exam does to show your composite score, your predicted AP score and how many more points you need for a 3, 4 or 5.
Table of Contents
How to use the AP Stats score calculator
- Take a practice exam. Use a full released AP Stats exam or your teacher’s practice test, under timed conditions.
- Count your multiple-choice answers. AP exams have no penalty for wrong answers, so enter only the number you got right.
- Score your free-response answers. Use the official scoring guidelines and enter the points for each section. Change the “out of” box if your practice test used a different maximum.
- Read your result. The AP Stats score calculator shows your composite score out of 100, your predicted AP score and the extra points you need for the next score up.
AP Statistics exam format and weighting
AP Statistics covers exploring data, sampling and experiments, probability and random variables, and statistical inference for proportions, means and regression. The exam has 3 scored parts, and each one counts for a fixed share of your final score:
| Section | Points possible | Share of AP score |
|---|---|---|
| Multiple choice (40 questions) | 40 | 50% |
| Free response Q1–Q5 (0–4 each) | 20 | 37.5% |
| Investigative task Q6 (0–4) | 4 | 12.5% |
How the AP Stats score calculator works
The AP Stats score calculator turns each section into a percentage of its maximum points, multiplies it by that section’s weight and adds the results. That gives a composite score out of 100, which is compared with the estimated cutoff for each AP score.
Composite = sum of (points earned ÷ points possible × section weight)Multiple choice: points ÷ 40 × 50%Free response Q1–Q5: points ÷ 20 × 37.5%Investigative task Q6: points ÷ 4 × 12.5%
AP Stats score cutoffs (estimated)
| AP score | Composite (out of 100) | Meaning |
|---|---|---|
| 5 | 70 or higher | Extremely well qualified |
| 4 | 57–69 | Well qualified |
| 3 | 44–56 | Qualified |
| 2 | 33–43 | Possibly qualified |
| 1 | below 33 | No recommendation |
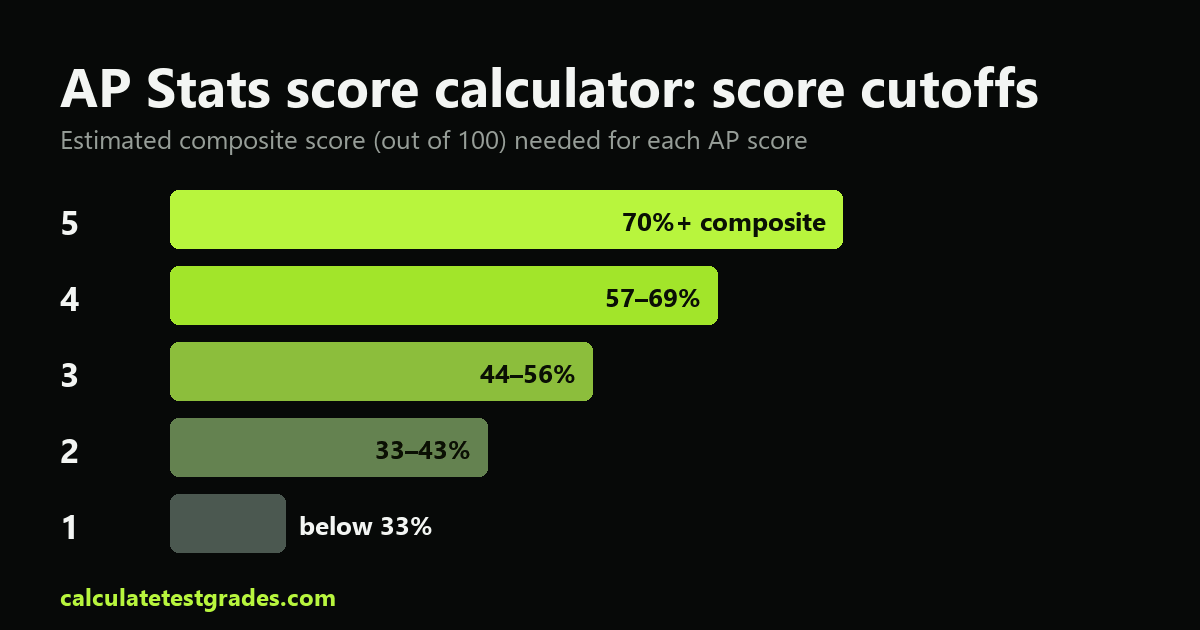
These cutoffs are estimates based on scoring data from past AP Stats exams. The College Board sets the exact cutoffs each year so that a 4 means the same level of achievement from one year to the next, which means the real numbers can move by a few points. Treat a composite within two or three points of a cutoff as a borderline result.
Worked example with the AP Stats score calculator
Suppose a student gets about 70% of the multiple-choice questions right and about 60% of the free-response points on a practice AP Stats exam:
- Multiple choice: 28 of 40 points → 28 ÷ 40 × 50% = 35.0
- Free response Q1–Q5: 12 of 20 points → 12 ÷ 20 × 37.5% = 22.5
- Investigative task Q6: 2 of 4 points → 2 ÷ 4 × 12.5% = 6.3
Composite: 63.8 out of 100, which predicts a 4 on AP Stats. To move up to a 5, the student needs about 6.3 more composite points.
How to raise your AP Stats score
AP Stats free-response answers are graded on communication as much as on calculation. Always state the procedure, check the conditions, show the test statistic and p-value, and write the conclusion in context.
The investigative task counts for 12.5% of the exam on its own. Read it twice, answer every part even if you are unsure, and connect your answers to the context of the problem.
On multiple choice, watch for questions about sampling methods, bias and the interpretation of confidence intervals. These concept questions are common and quick to score with practice.
After each practice test, enter your new points in the AP Stats score calculator and compare the result with your last attempt. Tracking your composite over several weeks shows whether your study plan is working and which section deserves your next hour of review.
What your AP Stats score means for college
AP scores run from 1 to 5. Many colleges give credit or placement for a 3 or higher, while selective colleges often ask for a 4 or 5 and some give credit only for a 5. Policies differ by college and by subject, so check the AP credit page of every school on your list. The College Board explains the full scale on its AP scores page.
AP classes can also raise your weighted GPA, because many high schools add a bonus point for AP courses. See how much with the high school GPA calculator, and use the final exam grade calculator to protect your class grade before the exam.
Other AP score calculators
- AP score calculator for all exams
- AP Lang score calculator
- AP Lit score calculator
- AP Bio score calculator
- AP Chem score calculator
- AP Calc AB score calculator
- AP Calc BC score calculator
- AP Psych score calculator
- AP World score calculator
- APUSH score calculator
- AP Euro score calculator
- AP Gov score calculator
- AP Physics 1 score calculator
- AP Physics 2 score calculator
- AP Physics C Mechanics score calculator
- AP Macro score calculator
- AP Micro score calculator
- AP Precalc score calculator
- AP CSA score calculator
- AP CSP score calculator
- AP Human Geography score calculator
- APES score calculator
Frequently asked questions
How is the AP Statistics exam scored?
The AP Stats exam has 3 scored parts: Multiple choice (50%); Free response Q1–Q5 (37.5%); Investigative task Q6 (12.5%). Each part is converted to a weighted score, the parts are added into a composite score, and the composite is converted to an AP score from 1 to 5.
What composite score do you need for a 5 on AP Stats?
Based on past exams, a composite of about 70 out of 100 has been enough for a 5 on AP Stats, about 57 for a 4 and about 44 for a 3. The College Board adjusts the exact cutoffs every year, so treat these as estimates.
Is a 3 a good score on AP Stats?
Yes. A 3 means “qualified” and earns credit or placement at many colleges. Selective colleges often require a 4 or 5, so check the AP credit policy of each college you are interested in.
How accurate is this AP Stats score calculator?
The section weights follow the official AP Stats exam format, so the composite is accurate for the points you enter. The score cutoffs are estimates from past exams, so your real AP score can differ by one point when your composite is close to a cutoff.
Is there a penalty for wrong answers on the AP Stats exam?
No. AP exams do not take off points for wrong multiple-choice answers, so answer every question, even if you have to guess.